by | on 27 October 2017
On the verge of quantum technologies arising, precise time-correlated photon counting is one of the key components to analyze quantum devices. The data acquisition and evaluation for the application presented below is a good example to show the benefit of Swabian Instrument’s Time Tagger for analyzing single photons signals detected by APDs.
Sparrow Quantum and Montana Instruments demonstrate with their demo setup for their powerful single-photon chip a steady stream of single photons with an extraordinary coupling efficiency using the Montana Instruments Cryo-Optic X-Plane System.

The X-Plane System (very left of Figure 1) includes the Cryogenic sample, mount, and objective. The excitation, collection and imagining optics including the spectral filter and the Hanbury Brown and Twiss setup is located inside the enclosure to minimize stray light and to provide a protected environment. More details about the demo setup and the measurements can be found in the following application note: Integration of the Sparrow Quantum Single-Photon Chip with the Montana Instruments Cryo-Optic X-Plane system
The performance of the photon source is measured with the Time Tagger 20 (top right): correlated photons are counted in the HBT configuration with the multiple-start / multiple-stop functionality provided from the correlation measurement class of the Time Tagger API. The easy to use interface, including the capability for a live evaluation of the data, suits very well for this purpose.

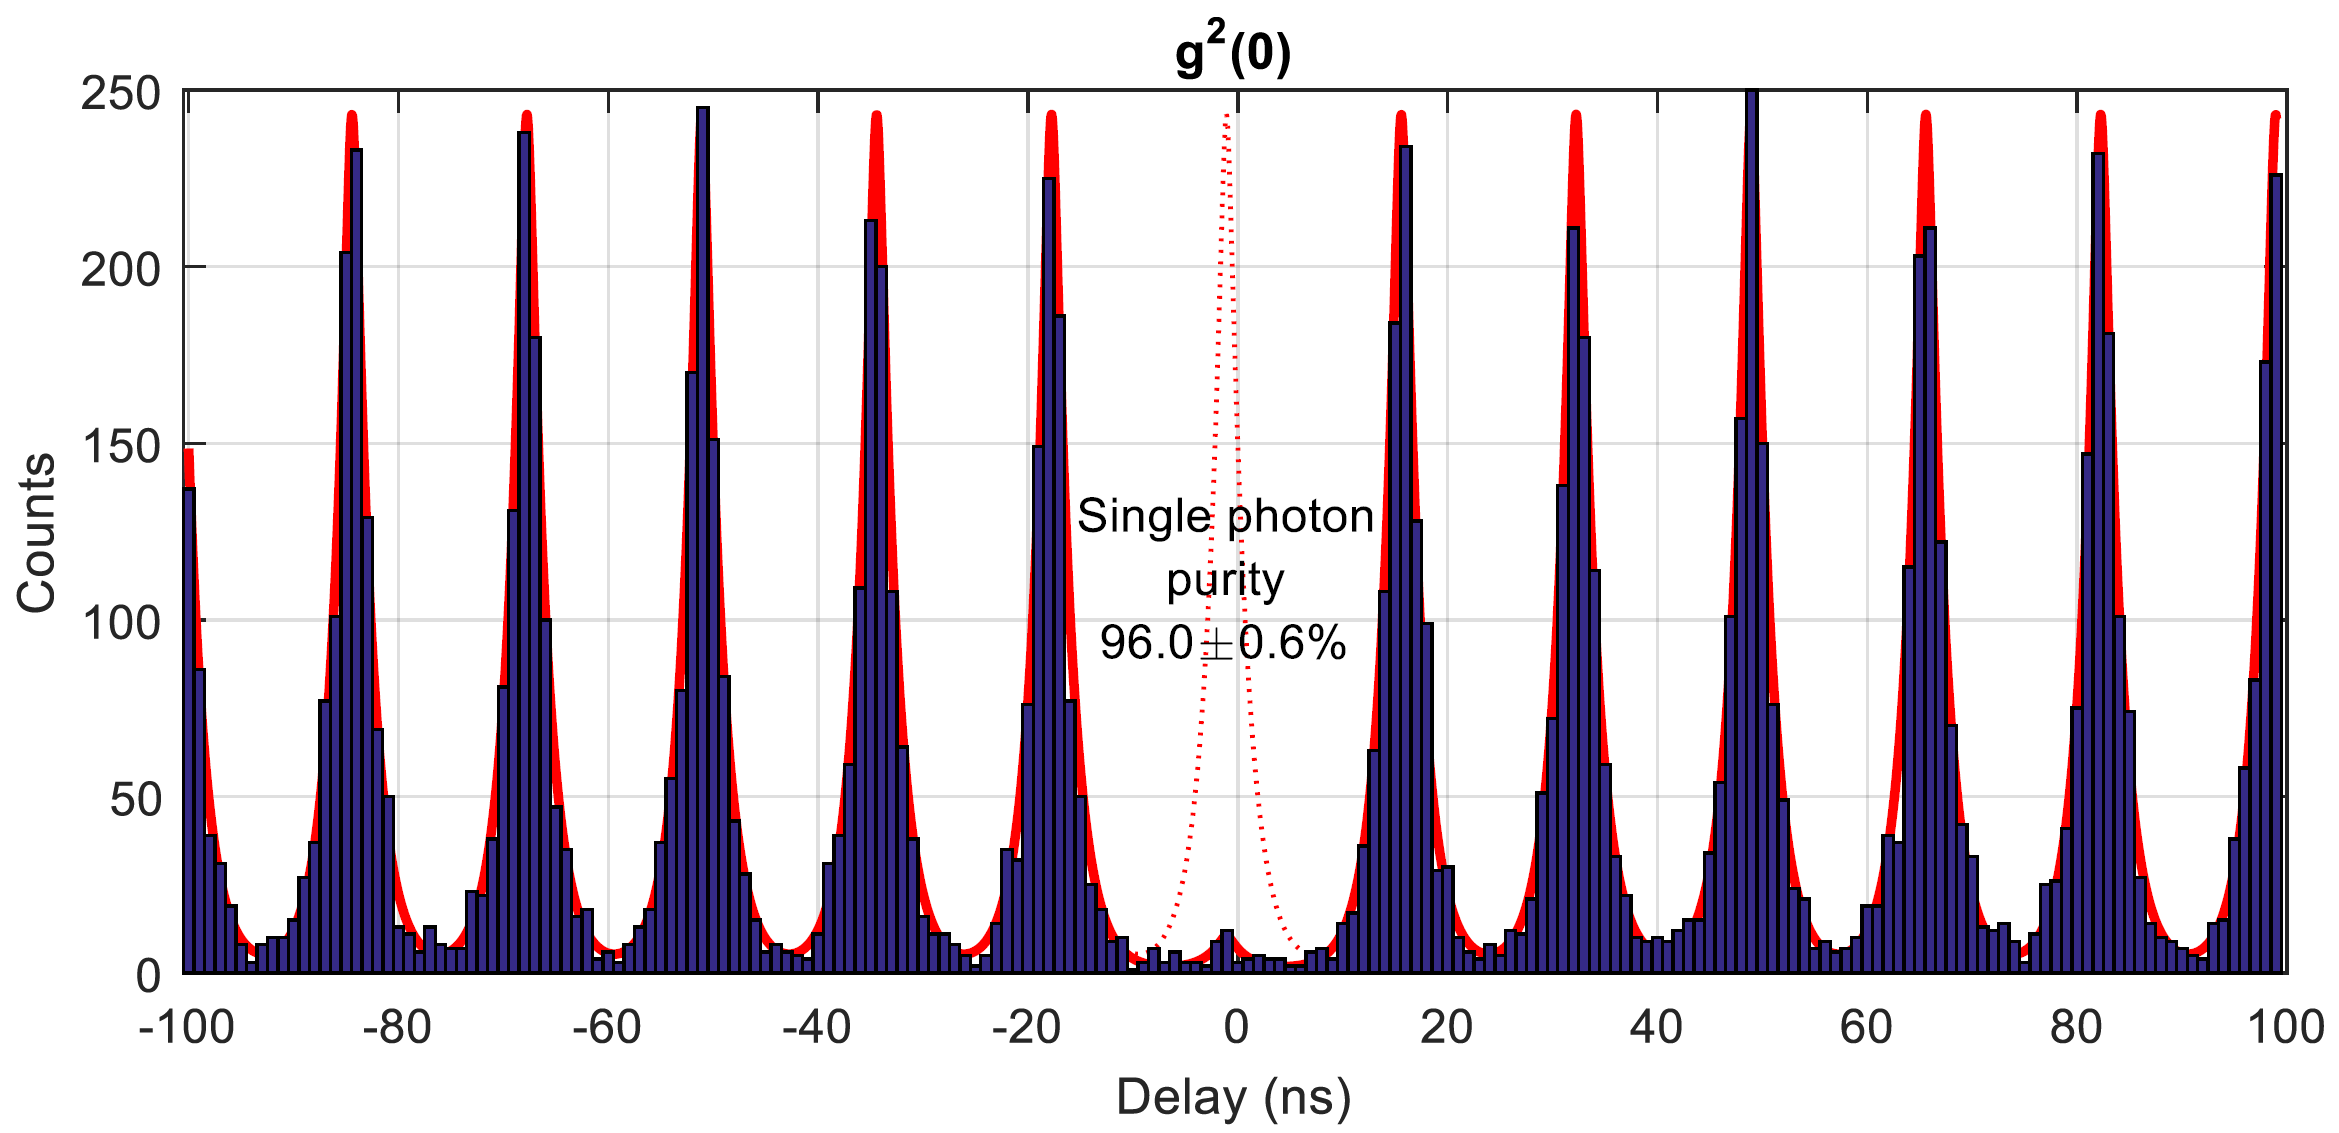
The evaluated data (Figure 2) shows a very low g2(0) signal and demonstrates the single-photon emission for an excitation frequency of 60 MHz. In addition, the equal heights of the peaks illustrate that the source is stable and does not suffer from emitter blinking.
We ended up using the Time Tagger with a small C# application, which was really easy to realize. With only a few lines of code, we were able to analyze the performance of our single-photon source. I can recommend the Time Tagger – especially for doing your own control software.
To acquire, accumulate and analyze the data with a multiple-start / multiple-stop analysis takes only two lines with the Time Tagger API (Python, Matlab, C#, …):
Line 1: initialize the measurement
                            Ch, Ch, window in ps
> correlation = Correlation(timetagger, 0, 1, 200)
Line 2: evaluate the integrated data
> histogram = correlation.getData()
This very easy way to acquire and evaluate data shows one aspect of the benefits provided due to the Software Defined Data Acquisition introduced by Swabian Instruments.