Getting Started
The following section describes how to get started with your Time Tagger.
First, please install the most recent driver/software, including graphical user interfaces, libraries, and examples for C++, Python, .NET, C#, LabVIEW, and MATLAB.
Time Tagger software download
You are highly encouraged to read the sections below to get started with the graphical user interface and/or the Time Tagger programming libraries.
Additional information about the hardware, API, etc. can be found in the menu bar on the left and on our main website: https://www.swabianinstruments.com/time-tagger/.
If you are using Linux, please take a look at the Linux section.
Get familiar with your Time Tagger
To learn more about the Time Tagger you are encouraged to consult the following resources.
Run the Graphical User Interface, Time Tagger Lab or the Web Application, to play with your Time Tagger interactively. The examples below will allow you to experience basic data acquisition. Play with the Time Tagger settings to see their effects on typical measurements.
Check out the Application Programming Interface chapter. It gives you a detailed overview of all Time Tagger features and data processing classes. Check out the following sections to get started using the Time Tagger software library in the programming language of your choice.
Study the code examples in the
.\examples\<language>\folders of your Time Tagger installation.
Graphical User Interfaces
Time Tagger Lab
Time Tagger Lab is the Graphical User Interface (GUI) application for Windows operating systems. It is designed to perform standard measurements quickly and to get an interactive experience with your Time Tagger. Here, you can read a brief description how you can set up a simple cross correlation measurement in Time Tagger Lab. For a full tutorial to the software, please refer to getting started with Time Tagger Lab.
Download and install the most recent Time Tagger software from our downloads site.
Start
Time Tagger Labfrom the Windows start menu.The Time Tagger Lab welcome screen opens and presents all available devices. If you plug or unplug a Time Tagger, the display will update automatically.
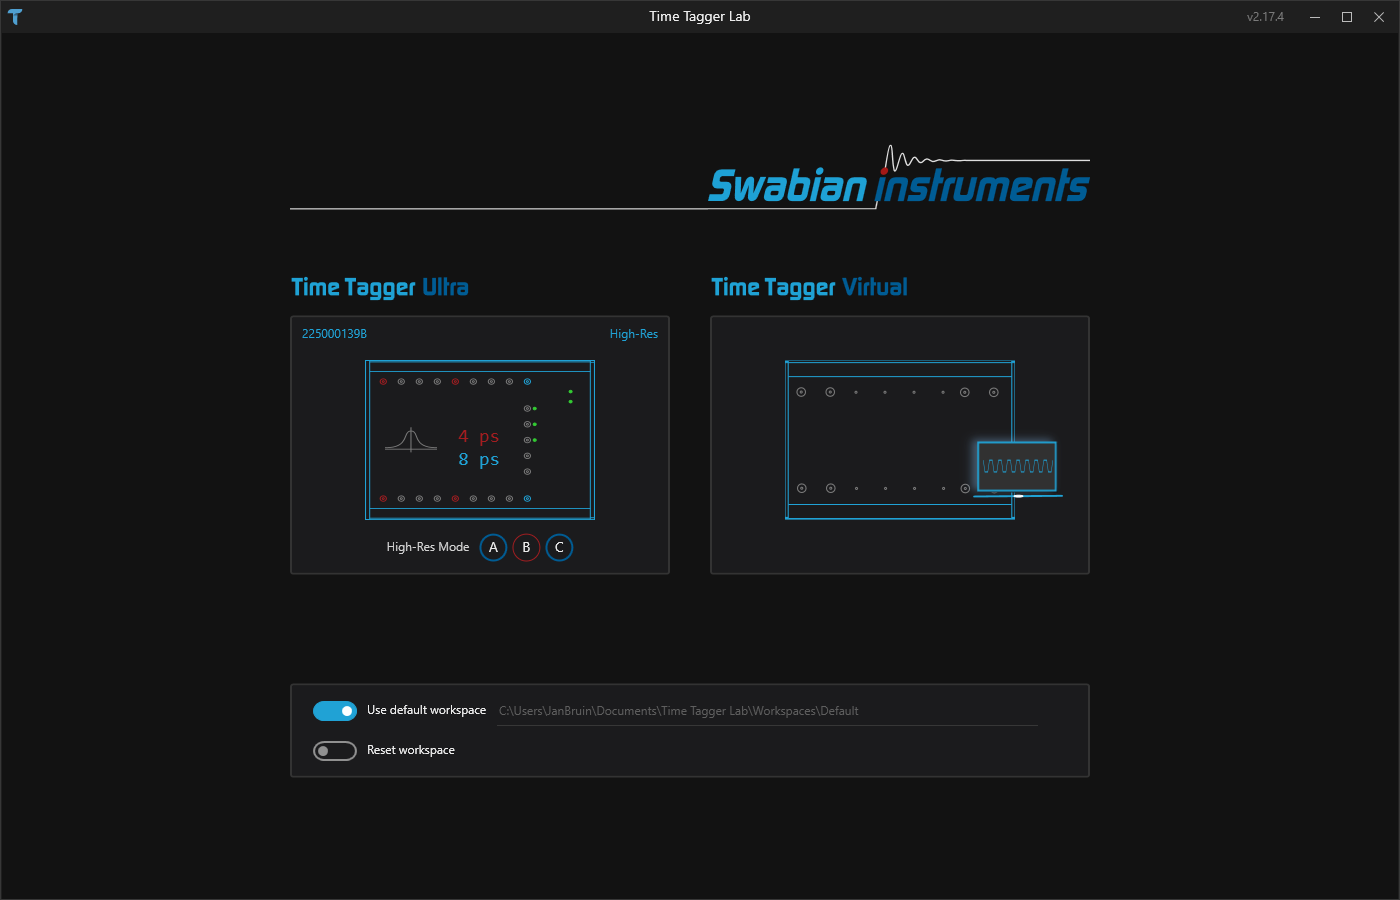
Time Tagger Lab allows you to work with your Time Tagger interactively. We will now use the Time Tagger’s internal test signal to measure a cross correlation between two channels as an example.
On the welcome screen, click on the panel representing your desired device. The
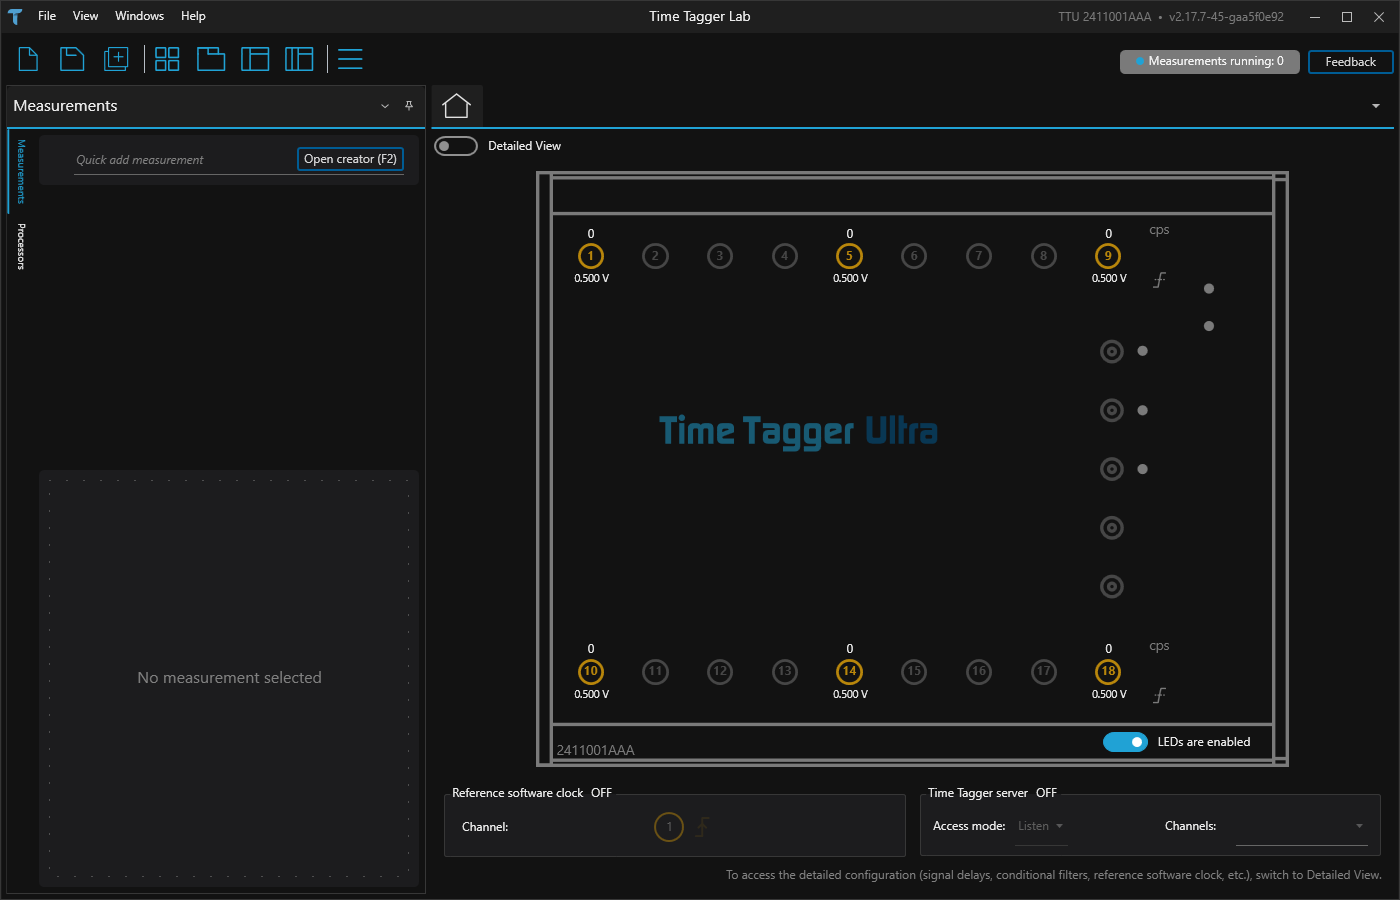
Homescreen of your Time Tagger shows up.On the top of the
Homescreen, you can toggle between the basic display you are currently looking at and theDetailed View. Activate theDetailed View.In the upper panel of the
Detailed View, you can change settings for every input. Activate the internal test signal on inputs 1 and 2 by checking the boxes on the rightmost column.Go back to the basic display by deactivating
Detailed view. The count rate displays (cps) show a test signal count rate of 800 to 900 kHz, and the trigger level setting is replaced by the labeltest signal.
With the activated test signal, we can start our first measurement.
Click on
Open creator (F2)in theMeasurementspanel on the left. The creator gives you an overview of all available measurements.Pick
Bidirectional histogram - Correlation. Now you can read through a detailed description and change the initial settings of your measurement.Set
Reference channelto 1 andClick channelto 2. ClickAdd measurement.The measurement graph is showing up. To start the measurement, click the
Playbutton next to the graph.A Gaussian peak should be displayed. You can zoom in using the controls on the plot. If the resolution is not sufficient, try a smaller
Bin widthin the measurement settings.The detection jitter of a single channel is
 times the standard deviation of this two-channel measurement (the FWHM of the Gaussian peak is 2.35 times its standard deviation).
You have just verified the time resolution (detection jitter) of your Time Tagger.
Web Application
The Web Application is the traditional provided GUI for Windows and Linux for quick measurements. On Windows systems, we recommend switching to Time Tagger Lab today.
Download and install the most recent Time Tagger software from our downloads site.
Start the
Time Tagger Applicationfrom the Windows start menu.The Web Application should show up in your browser.
Note
The Web Application uses the TCP port 50120 as default port. If this collides with another application you can change the port with passing the argument TimeTaggerServer.exe -p 50120.
The Web Application allows you to work with your Time Tagger interactively. We will now use the Time Tagger’s internal test signal to measure a cross correlation between two channels as an example.
Click
Add TimeTagger, clickInit(select resolution if available) on any of the available Time Taggers.Click
Create measurement, look forBidirectional Histogram (Class: Correlation)and clickCreatenext to it.Select
Rising edge 1for Channel 1 andRising edge 2for Channel 2.Set
Binwidthto 10 ps and leaveNumber of data pointsat 1000, clickInitialize.
The Time Tagger is now acquiring data, but it does not yet have a signal. We will now enable its internal test signal.
On the top left, click on the settings wheel next to
Time Tagger.On the far right, check
Test signalfor channels1and2, clickOk.A Gaussian peak should be displayed. You can zoom in using the controls on the plot.
The detection jitter of a single channel is
times the standard deviation of this two-channel measurement (the FWHM of the Gaussian peak is 2.35 times its standard deviation).
You have just verified the time resolution (detection jitter) of your Time Tagger.
Programming languages
Python
Make sure the Time Tagger software is installed.
Make sure that your Time Tagger device is connected to your computer and the Time Tagger Lab is closed.
- Make sure a Python distribution is available.
On Unix/Linux systems, a system-supported installation of Python should already be present.
On Windows systems, you can install Python by following these instructions. We recommend the default installation (“Install Now”), as it includes all standard libraries and pip.
Make sure to install the required Python packages NumPy, Matplotlib, and ipython.
Open a command shell and navigate to the
.\examples\python\1-Quickstartfolder in your Time Tagger installation directory.Start an ipython shell with plotting support by entering
ipython --pylab.Run the hello_world.py script by entering
run hello_world.
The hello_world executes a simple yet useful measurement that demonstrates many essential features of the Time Tagger programming interface:
Connect your Time Tagger.
Start the built-in test signal (~0.8 MHz square wave) and apply it to channels 1 and 2.
Control the trigger level of your inputs - although it is not necessary here.
Initialize a standard measurement (
Correlation) in order to find the delay of the test signal between channel 1 and 2.How to control the delay of different inputs programmatically.
You are encouraged to open and read the hello_world.py file in an editor to understand what it is doing.
With this basic knowledge, you can explore the other examples in the 1-Quickstart folder:
No. |
Topic |
Classes & Methods |
|---|---|---|
Basic software control (folder 1-basic_software_control) |
||
1-A |
Create a measurement |
|
Count rate trace |
||
1-B |
Start & stop measurements |
|
1-C |
Synchronize measurements |
|
Use different histograms |
||
1-D |
Virtual Channels |
|
1-E |
Logging errors |
|
1-F |
External reference clock |
|
Controlling the hardware (folder 2-controlling-the-hardware) |
||
2-A |
Get hardware information |
|
2-B |
The input trigger level |
|
2-C |
Filter tags on hardware |
|
2-D |
Control input delays |
|
2-E |
Overflows |
|
2-F |
HighRes mode |
|
Dump and re-analyze time-tags (folder 3-dump-and-reanalyze-time-tags) |
||
3-A |
Dump tags by FileWriter |
|
3-B |
The Time Tagger Virtual |
|
Working with raw time-tags (folder 4-working-with-raw-time-tags) |
||
4-A |
The FileReader |
|
4-B |
Streaming raw time-tags |
|
4-C |
Custom Measurements |
|
More details about the software interface are covered by the API documentation in the subsequent section.
LabVIEW (via .NET)
In LabVIEW, you can access and program your Time Tagger through .NET interoperability.
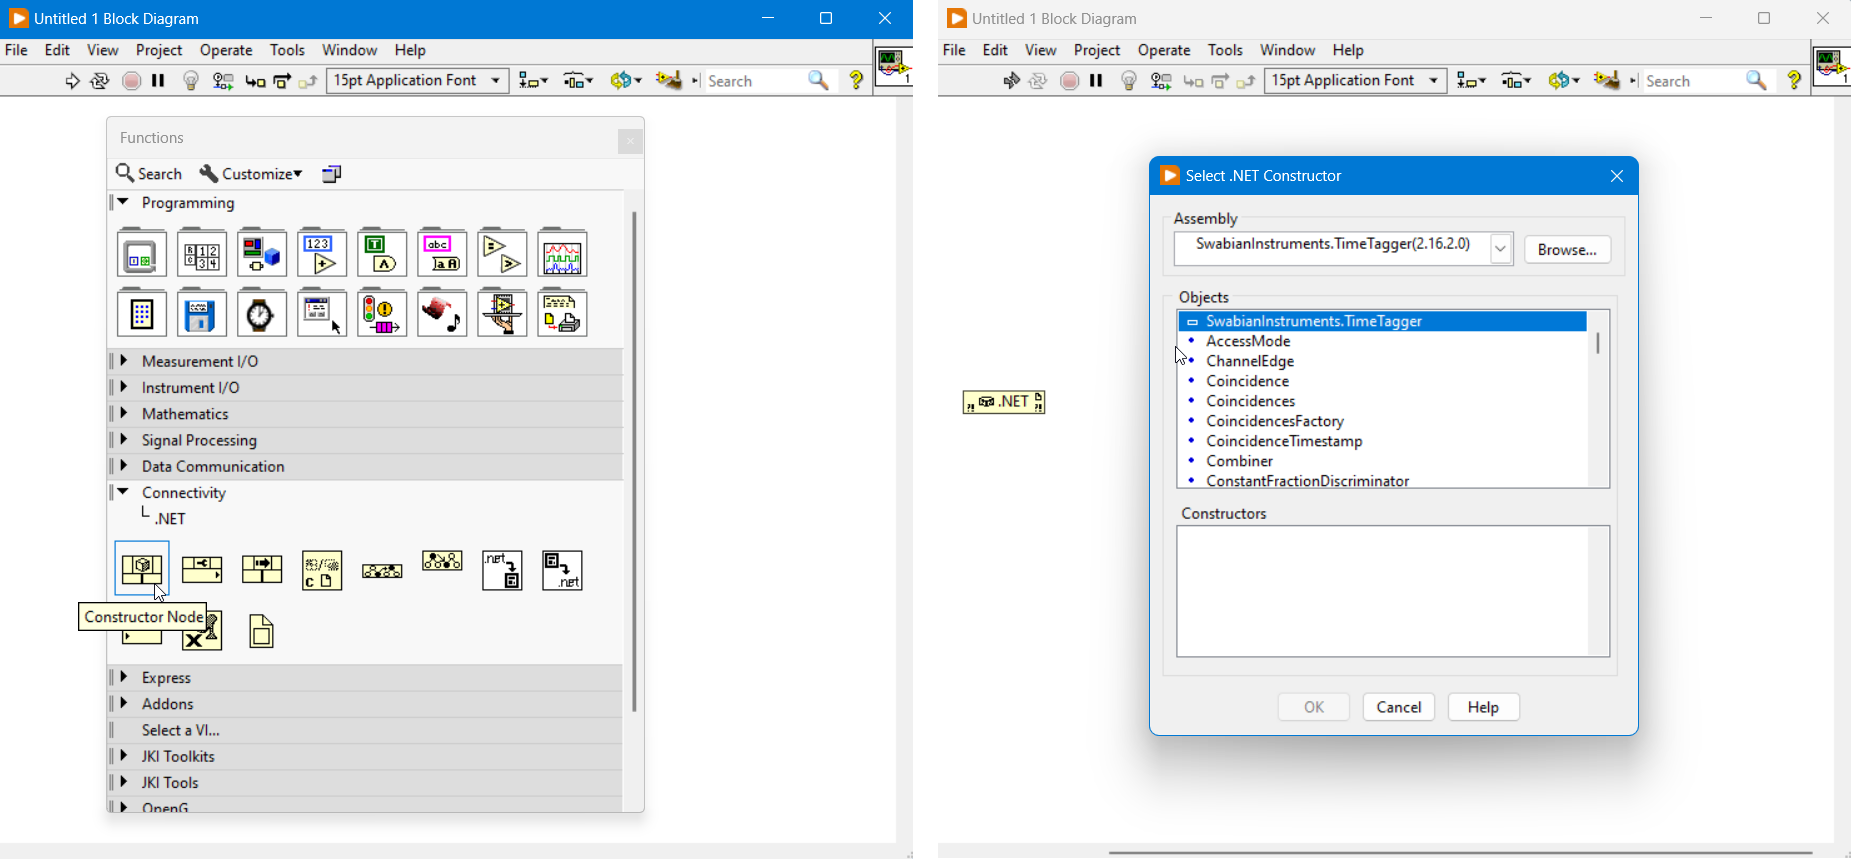
A set of examples is provided in .\examples\LabVIEW\ for LabVIEW 2014 and higher (32 and 64 bit).
MATLAB (wrapper for .NET)
Wrapper classes are provided for MATLAB so that native MATLAB variables can be used.
The Time Tagger toolbox is automatically installed during the setup. If TimeTagger is not available in your MATLAB environment try to reinstall the toolbox from
.\driver\Matlab\TimeTaggerMatlab.mltbx.
The following changes in respect to the .NET library have been made:
static functions are available through the
TimeTaggerclass,all classes except for the
TimeTagger,TimeTaggerNetwork, andTimeTaggerVirtualclasses will have aTTprefix (e.g.TTCountrate) to prevent conflict with any variables/classes in your Matlab environment.
Several examples demonstrating how to use the Time Tagger with MATLAB are provided in the .\examples\Matlab\ folder.
The 1-Quickstart directory is structured into three subfolders (1-, 2-, and 3-), mirroring the Python quickstart examples.
These cover core topics such as basic measurements, hardware control, and postprocessing,
providing a one-to-one correspondence between MATLAB and Python usage.
Wolfram Mathematica (via .NET)
Time Tagger functionality is provided to Mathematica via the .NET interoperability interface.
.NET
We provide a .NET class library (32, 64 bit and CIL) for the TimeTagger which can be used to access the TimeTagger from many high-level languages.
The following are important to note:
Namespace:
SwabianInstruments.TimeTagger,the corresponding library
.\driver\xxx\SwabianInstruments.TimeTagger.dllis registered in the Global Assembly Cache (GAC),static functions (e.g. to create an instance of a TimeTagger) are accessible via
SwabianInstruments.TimeTagger.TT.
C#
A sample Visual Studio C# project provided in the .\examples\csharp\Quickstart directory covers the basics of how to use the Time Tagger .NET API.
An example of creating ‘custom measurements’ is also included.
Please copy the project folder to a directory within the user environment such that files can be written within the directory.
An ‘Example Suite’ is provided in the .\examples\csharp\ExampleSuite directory. ‘Example Suite’ is an interactive application that demonstrates various measurements that can be performed with the TimeTagger.
Reference source code to setup and plot (with OxyPlot) each measurement is also provided within the application.
Additionally, the application contains examples for creating and using ‘Virtual channels’, ‘Filtering’ and ‘Accessing the raw time tags’.
Note
Running the Example Suite requires ‘.NET Core 3.1 Desktop Runtime (v3.1.10)’.
C++
The provided Visual Studio C++ project can be found in .\examples\cpp\.
Using the C++ interface is the most performant way to interact with the Time Tagger as it supports writing custom measurement classes with no overhead.
But it is more elaborate compared to the other high-level languages.
Note
the C++ headers are stored in the
.\driver\include\folder.the final assembly must link
.\driver\xYZ\TimeTagger.lib.the library
.\driver\xYZ\TimeTagger.dllis linked with the shared v142 or newer Visual Studio runtime (/MD).use
TimeTaggerD.libandTimeTaggerD.dllfor the Visual Studio debug runtime (/MDd).use
libTimeTagger.dllandlibTimeTagger.afor the MinGW C++ ABI for the MINGW32 and UCRT64 environment.
Debug and Release Builds
The choice of build type can have a great effect on the code performance.
In Visual Studio, the default compiler flags for Debug builds are /MDd, /O0, and /Zi. For Release builds these are /MD, /O2, and /DNDEBUG.
It is crucial that you understand these flags and their implications on performance.
/O0vs/O2This flag controls the general optimization level.
/O0means no optimization, so every instruction is surrounded byload_from_memoryandstore_to_memory. This is a significant waste of CPU resources, but guarantees that every local variable can be inspected at all times. We suggest the use of the default optimization level/O2and to overwrite it only for required methods using pragmas (see the MSVC optimize pragma).
/MDdvs/MDThis flag selects which (incompatible) runtime C++ ABI you want to use for the whole project. The debug runtime
/MDdhas additional fields and checks for e.g. better range checking. It is good practice to run your code with them at least once before each commit. As they are incompatible with each other, all linked C++ libraries must use the same runtime. This flag is the only difference between our debugTimeTaggerD.dlland non-debugTimeTagger.dlllibrary. We suggest using/MDeven for debug builds, otherwise the debug runtime will incur significant performance costs, including in the internals of the Time Tagger library.
/ZiThis flag tells the compiler to generate a
*.pdbsymbol file. This is used by the debugger to map e.g. the assembly to the C++ code and the stack to the local variable. As this has no performance overhead, we recommend using this flag for all internal builds.
/DNDEBUGThe macro
NDEBUGis the C way to disableassert(). Asserts are usually good at catching logic errors without much overhead.
The relevant choice is thus not whether to build using Debug or Release, but rather which set of flags to use. Please select each of them carefully based on your target.
Code Sanitizers
We recommend the use of code sanitizers. Switching your Visual Studio compiler to CLANG allows you to use its undefined behavior, address, and thread sanitizers. Microsoft has also recently announced the MSVC compiler now ships with an address sanitizer, which finds out-of-bounds accesses, use-after-free and similar issues. Please consult the documentation for the AddressSanitizer (ASan) for Windows with MSVC.